
Page 15 - 06-09-1400- Englishfinal
P. 15
Electricity Market Annual Report 2020-2021 13
30
bilion cubic metbielri/obnillciuobniclitmereter/billion liter 25
230
125
120
15
10 Summer Fall Winter
Spring
5 Mazut (lit) Gasoil (lit) Natural Gas (m3)
0 FiguFriegu8r:eVo8:luVmoleumofetohfethFeuFeluCeloCnosnusmumptpiotinonininththeeIInntteennddeeddFFiissccaall yyeeaarr
Spring Summer Fall Winter
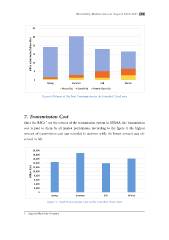
7. Transmission CostMazut (lit) Gasoil (lit) Natural Gas (m3)
7. Transmission CostSince the RECs are the owners of the transmission system in IREMA,
the transmisFsiigounre 8:cVooslutmeiosf thepFauidel Cotnosumtphtieomn in thbeyInteanldled Fmiscaarlkyeeatr participants.
ScS7rAoiensi.cccntceociosretdhrpdeTeatidhiRnrdegEianCtonRstsoutsE1hmmCaetrmmhseieestbharsyferwiieogaohluwnlitrnlhmeeeeCartsrh9okooe,ewsftltttonhphweaeerretstrishcatiinopgasfahmmnetoitssshuts.einoAatncmtwcrsoaoyarnsusdtseniomnmtbgissiotnesofriIovtRthnerEedaMnsfiisynAgmsu,ftratieehslmsle9.i,otrintanhnescmIhoRiisgsEtshiMeowsntAas,
atmheoun2tt0r,oa00fn0tsrmanissmsiiosnsionccoosstt wiass repcaoirddedtion sutmhemmer wbhyile athlle lomweasrtkaemt oupnatrtwicasipoabn-ts.
sAercvecdo1ri8dn,0i0nf0agll. to the figure 9, the highest amount of transmission cost was
recor1d6e,0d00in summer while the lowest amount was observed in fall.
14,000
billion Rials billion Rials 2102,000
180,000
186,000
164,000
142,000
120,000
8,000 Spring Summer Fall Winter
6,000
4,000 Figure 9: Total Transmission Cost in the Intended Fiscal Year
2,000
0 Fall Winter
8. Load DuSprrinagtion CurvSuemmer
TbehtewleoeandtdhuerlaotFaiiodgFnuairgnceuud9re:rtvT9io:metTaieolstTiasnrlhaTwnorswahmninsicsmshiiinostsnhitoheCneooCsfrotidsigtniuinntrahteteheeI1snI0ntre.teneTpnddreheedidssFeFiinsissctcaidalnleYgYfeieatnahrreedloaasdt,hpelroetltaetdioinn
18. .RegionLal EoleactrdicitDy Cuomrpaanytion Curve
The load duration curve is shown in the figure 10. This is defined as the relation
between the load and time in which the o8rdinates representing the load, plotted in