
Page 10 - 06-09-1400- Englishfinal
P. 10
8 Electricity Market Annual Report 2020-2021
Spot Market Summary Statistics
1. Generation
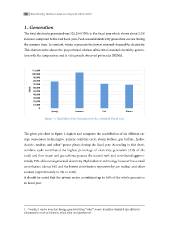
iTT1nhch.ereetaotsoteaGtlaceloelmeenclptereacircrteriatdiycttigoiteyotnhngeerealnateestdrafwitsecadasl3wy2e5aa,sr2.93P42eGa5k,W2s9eha4sinoGntWahlehefliesicnctartlihcyieetayfrigswecnhaeilcrhaytesiohanrowowcshcauibcrohsudstuh5ro.i2nw%gs
tahbeosuutm5m.2er%timinec. rIenacsoenctroamst,pwairnetdertroeptrheeselnatsstthfieslcoawleystesaera.sPoneaalkdesmeaasnodnfaolr eelleeccttrriiccitiyty.
Tgheinsecrhaatriaocnteroicstcicursshodwusrtihnegptrhoeposrutimonmalereltaitmioen. oIfnthceotnotraal ste,aswoninalteerlecretrpicrietsyegnetnsertah-e
tlioown ewsitthsethaesotenmalpdereamtuarnedanfdorisealefcretrqiuceitnyt.lyTohbissecrvheadrapcatteterrisntiinc sIRhoEwMsAt.he proportional
relation of the total seasonal electricity generation with the temperature and is a
frequently observed pattern in IREMA.
GWh 110,000
100,000
90,000
80,000
70,000
60,000
50,000
40,000
30,000
20,000
10,000
0
Spring Summer Fall Winter
FigFuigruer1e:1T:oTtaoltaEllEecletcrtirciictiytyGGeneneerraatitoionniinn tthhee IInntteennddeeddFFisicsacal lYYeeaarr
The given pie-chart in figure 2 depicts and compares the contribution of six
eeTgdAelrhleiagcefecsyfcctgerttociuirrcovrier,dcennbnniivtitneunypegrceisnlge,ieteo-ehaocrnnryhg,etdatyahrerrnacticodsthioeinnolnocoentfvhilchogea(teugrrr4ristir13ce,eiso%,pc,2nnoonwudomtaeceefmplrcbteiehhicpalnnteylrseao,ntcaalooctnonstmydgaddclibc)euloioesnratmi,hennc-nepdgocraayn2ttmrchhetplrseeeeoi,lnbtfwyhsiustseecetcteaarecodlmoapmynmlteatbthrauniiarernbt.nbsueAhidt-ndiicceouggcy,nrohacigrsenoldasegftsitu,nsttrsigpuhxbtreeetibdornaficimenfitefssheenc,irtpstaeuhaolncrygstbhydesaieerenrnoaoste--r,sf,.
ctohme bsineecocnydcleraconnktriabnudtedcothnetrihbiughteedst paperpcreonxtaigmeaotefleylec2t5ri%cityogfenthereattioontal(43g%enoefrattheed
teolteacl)traincdityth. eHn ystderaomelaencdtrigcastteucrhbninoelsogpoyssheosswtehveesrechoansd aransmk anlld contribbuutteidonap(parbooxiu-t
m6%ate)lya2n5d%tohfethleotwoteasltgecnoenrtartiebduetlieocntrirceitpyr. eHsyednrtoselbeyctraicretecnhuncolleoagry ahnowdeovethr ehrassaosumrcaells
c(oanptprirbouxtiimonat(eablyoutot 63%%) ainndtotthael)l.owest contribution represents by are nuclear and other
sIotusrhceosu(ladppbreoxnimotaetdelythtoat3t%heinptroivtaal)t.e sector contributed up to 54% of the whole
Igtesnheorualdtiobne ninotfeidsctahlatyethaer.private sector contributed up to 54% of the whole generation
in fiscal year.
2 Overall, it can be seen that Energy generated from “other” source is further classified into different
subcategories such as biomass, wind, solar and geothermal.
1. Overall, it can be seen that Energy generated from “other” source is further classified into different
subcategories such as biomass, wind, solar and geoth3ermal.