
Page 15 - Electricity Market Annual Report 2019-2020
P. 15
14 Electricity Market Annual Report 2019-2020
GGeenneerraattiioonn
GTToeottnaalleeelrelecatcrttirciictoyitngyengeernaetiroantiwonas w30a9s,330049G,3W0h4 iGn Wthehfiisncatlhyeeafrisacnadlmyaenairfeastnsd6,m45a0nGifWeshts
T6og,rt4ao5wl0tehlGecWcotmrhipcgairtyeodwgttoehntheceroamltaispotanfrisewcdaaltsoye3tahr0.e9,l3as0t4fiGscWalhyeianr.the fiscal year and manifests
6,450 G12W0,0h00growth compared to the last fiscal year.
12100,00,00000
1008,00,00000
806,00,00000
GWh GWh
604,00,00000
402,00,00000
20,000
Spring Summer Fall Winter
SprFiniggure 6: Total EleScutmrimcietyr Generation in FFiascllal Year Winter
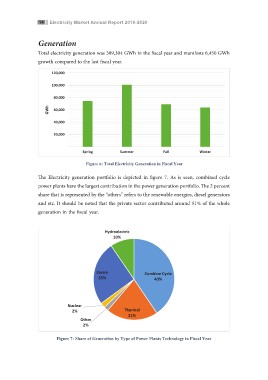
TThhee EElelcetcritcriitcyitgyengereaFntiiegournaretpi6oo:nrTtofotpaloiloErtliefscotdlriieocpitiycitGseedndeiernaptfiiiocgntueirndeF7iis.ncaAlsfYieigsaursreeen7, .comAbsiniesd csyecelne,
tgcToogctpehasgpoonmerhneteoihnmnaedtvwbhreereaebeEiaerertnratriattelcntieheprtei.oieensaodlcoaInntedne-ttnncreic-wptssiictwysphncooryachooiearrbcttluparthbyelclfvtrleeelfdooeeeoslfntgpebieilhpestionneoercoenotn.eiwane.eblwTlreadoTruegrryeghtgratbhieerieeeeatydeesdisrp2sott.p,2th,alchnlpdaeoprdaaneointne“ierpoetutrttsscrtshsconieheebeerdlenlutnhhrpfgt5tgtsaoari”se1ovseivlvhnrnhi%neeaeoaeaetifrenerrroetaetraihshtfststhettoeoeththceohrrtaadpsosetllttreohaaaaiiwwperrcssnnggioehrdrdrceerneeoetnsstgepepelrtteeedtirtrwnbcceegcu.ec.asseroitbeoIeIaenntnlntnntdeeittsttosreerraehfhinanidridbobogotepuiuburuubuoogtylntylrinrdiidoedetotftsinhbonhn,b5ele7de1ietoi%.i"hni"en.onnseoTotAoeohthtlffthteeistheegdtsheree2dhcresneitsap"shet"lpehwrraprayoreahtcstoeefwteooetefwanrhlteeeresrtheesnrr.esr,
private sector contributed aroHuyndrdoe5le1c%tric of the whole generation in the fiscal year.
10%
Hydroelectric
10%
Steam Combine Cycle
25% 40%
Steam Combine Cycle
25% 40%
Nuclear
2% Thermal
21%
NuclearOther
2% 2% Thermal
21%
Figure 7: ShOa2trh%eeorf Generation by Type of Power Plants Technology in Fiscal Year
Figure 7: Share of Generation by Type of Power Plants Technology in Fiscal Year
10
10 